‘rxylib Shiny’ is a Shiny app providing a graphical user interface for the R package ‘rxylib’. The app allows visualising x-y data from different file formats. For a complete overview see the ‘rxylib’ manual.
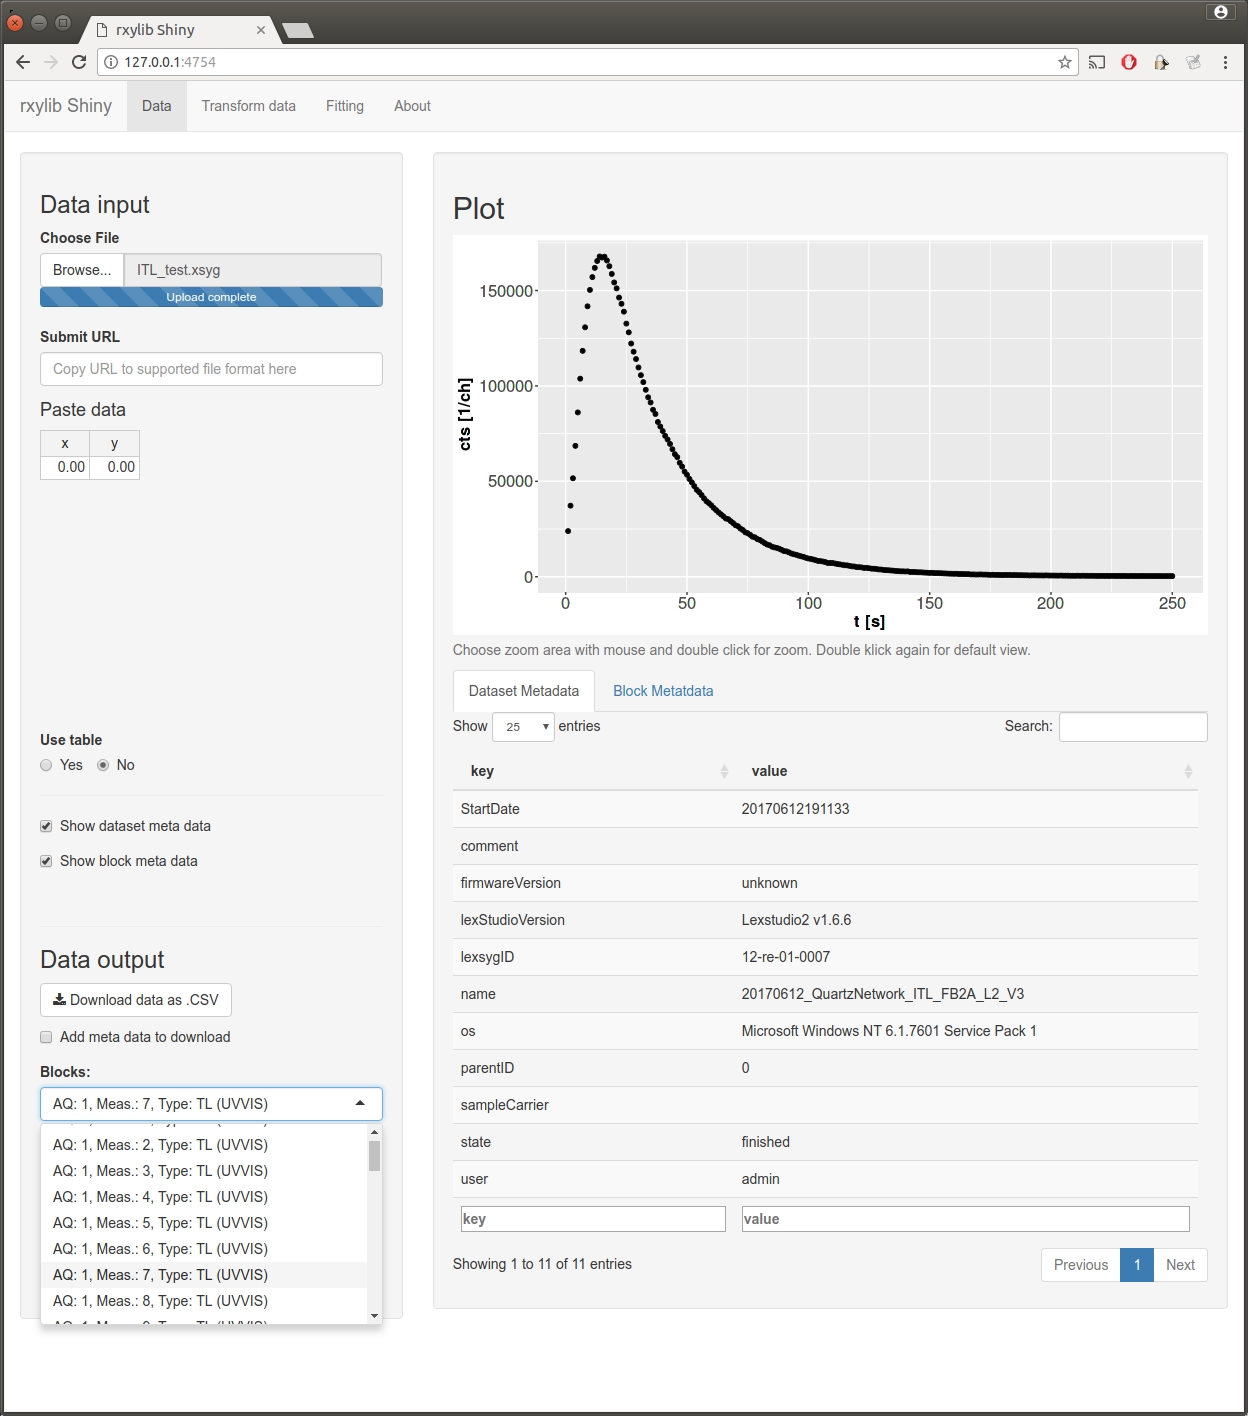
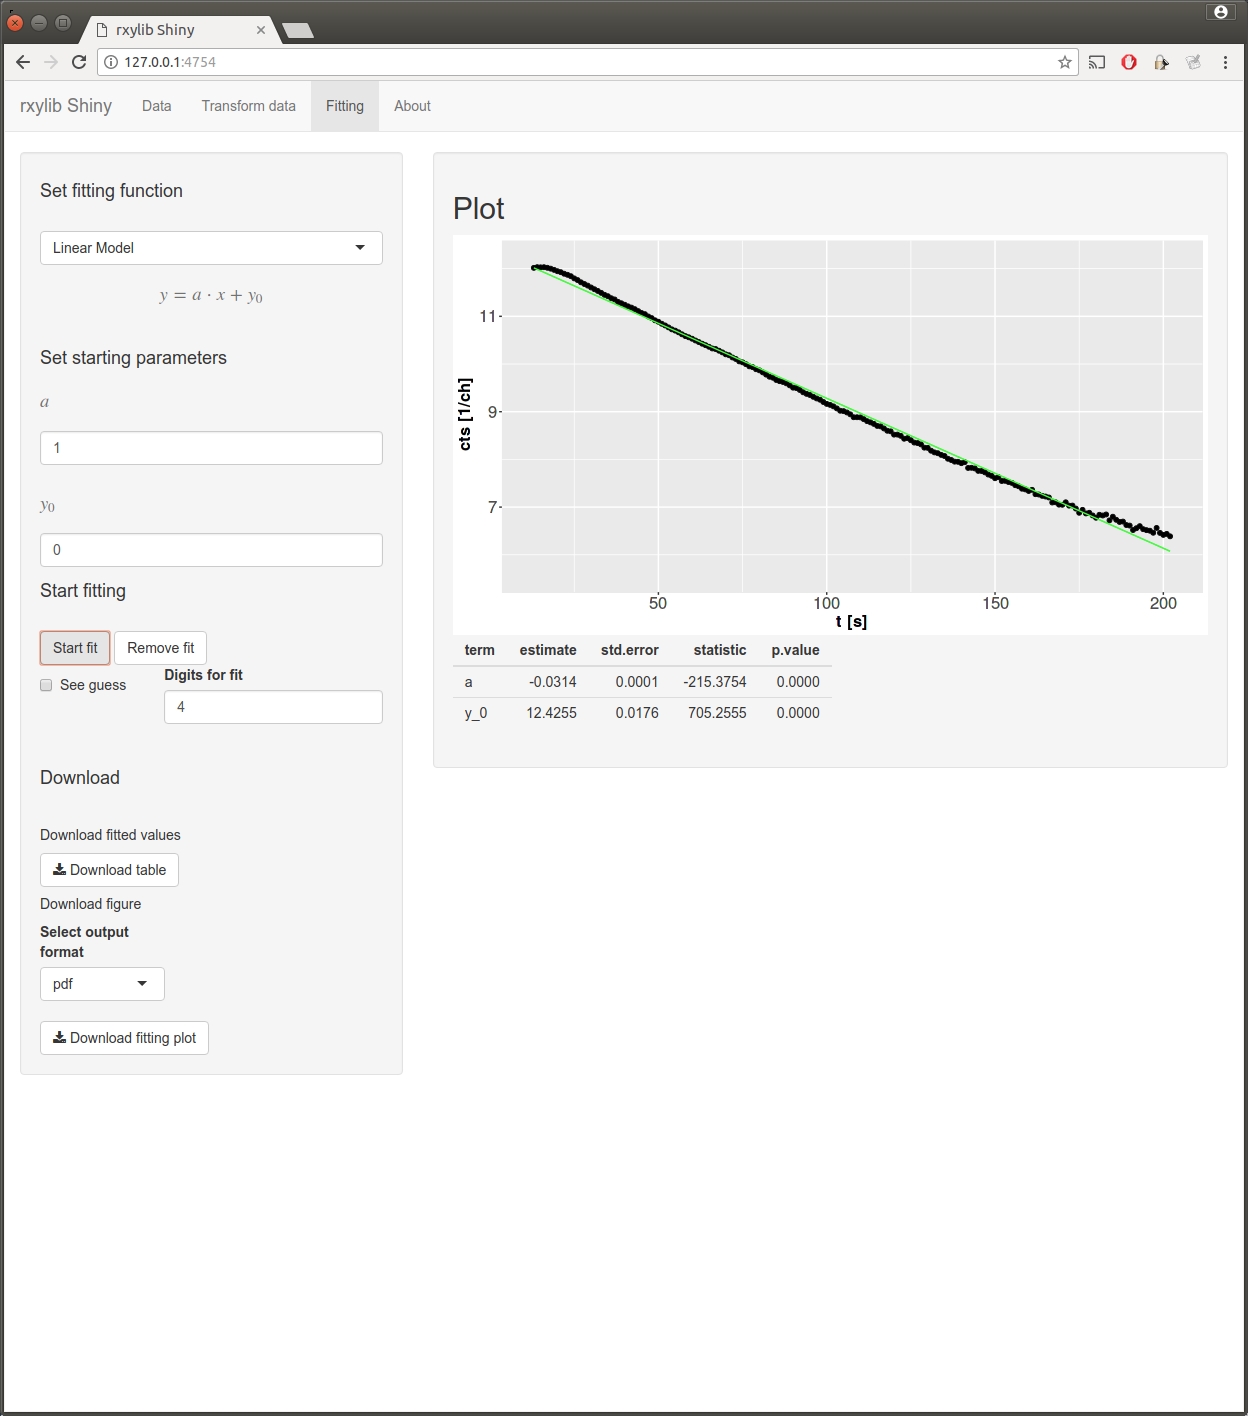
It is possible to load different file formats and see the x-y plot. You can zoom in, investigate details in your data and fit the data. Another feature is the transformation of data, e.g. translating wavelength spectra into energy sepctra or normalisations, …
Some Highlights:
- Interactive plots
- Copy-paste your data into the application
- Build-in transformations
- Fit data to different functions
- Download converted data as *.csv file
- Download fitted values and figures as pdf, eps, jpeg, …
Installation and usage
if(!require("devtools"))
  install.packages("devtools")
devtools::install_github("JohannesFriedrich/rxylibShiny@master")
The application can be run on a local machine with the following command:
rxylibShiny::run_rxylib()License
This program is free software: you can redistribute it and/or modify it under the terms of the GNU General Public License as published by the Free Software Foundation, either version 3 of the License, or any later version.
This program is distributed in the hope that it will be useful, but WITHOUT ANY WARRANTY; without even the implied warranty of MERCHANTABILITY or FITNESS FOR A PARTICULAR PURPOSE.
Links
- Browse source code at
https://github.com/JohannesFriedrich/rxylibShiny - Report a bug at
https://github.com/JohannesFriedrich/rxylibShiny/issues
License
Developers
- Johannes Friedrich
Author, maintainer - Sebastian Kreutzer
Author - All authors...

